02Data analytics · Sales
Kafaat — Sales Analytics
An end-to-end data analytics project on about 2,000 sales deals across Saudi cities: from data cleaning and exploratory analysis to a forecasting model and an interactive dashboard, plus a cloud version on BigQuery.
In numbers
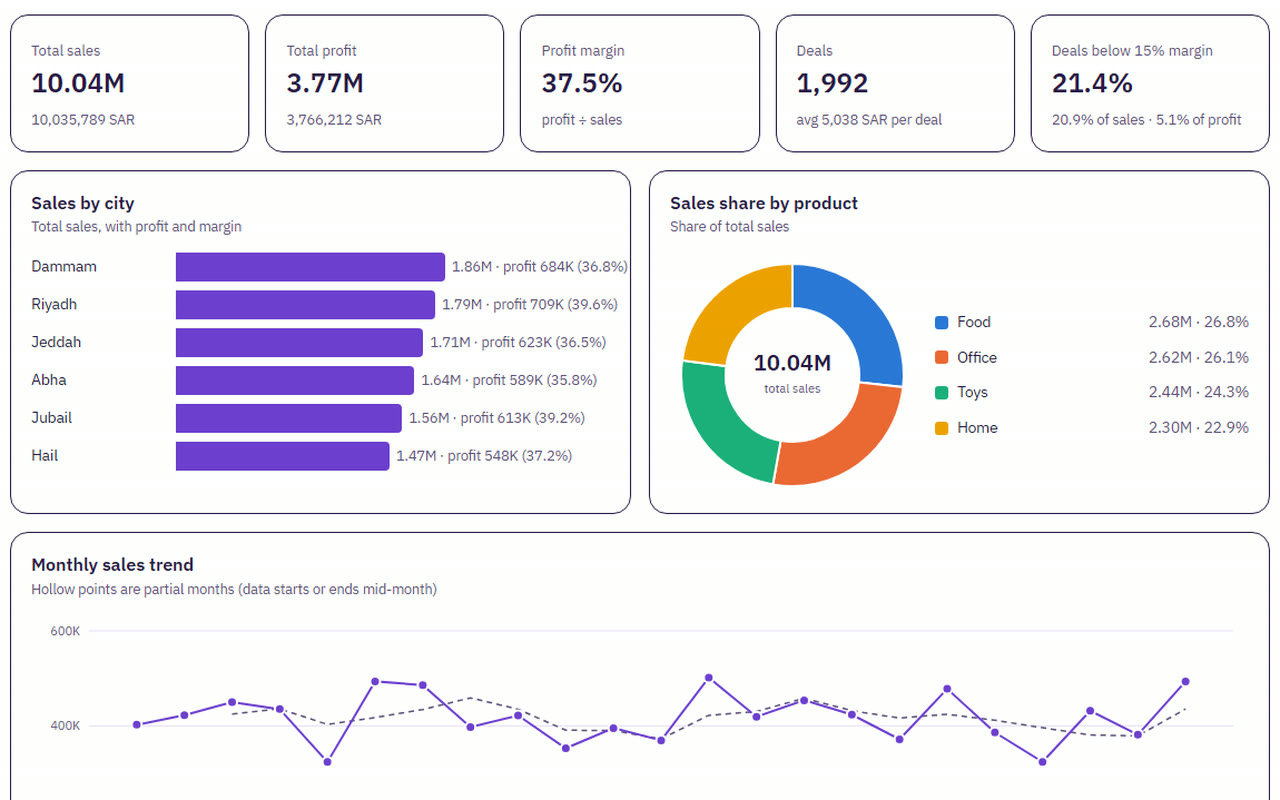
10.04MSAR of sales analyzed
1,992deals kept after cleaning, out of 1,998
37.5%overall profit margin
21.4%of deals have a margin under 15%
The challenge
A raw sales file with blanks, typos and outlier dates — and the need to understand where profit really comes from and to forecast upcoming sales.
The solution
Documented row-by-row cleaning, analysis by city, rep, store and product, a forecasting model, a dashboard that analyzes any sales file in the browser, and a cloud version on BigQuery and Looker Studio.
What it does
Cleaned the data and documented every removed row in a clear report
Found that 21.4% of deals have a margin under 15% and bring only 5.1% of profit
Random Forest model to forecast monthly sales, benchmarked against a naive baseline
A dashboard that analyzes any CSV or Excel file in the browser, without uploading it anywhere
My role
Full analysis and development